MATE Radar
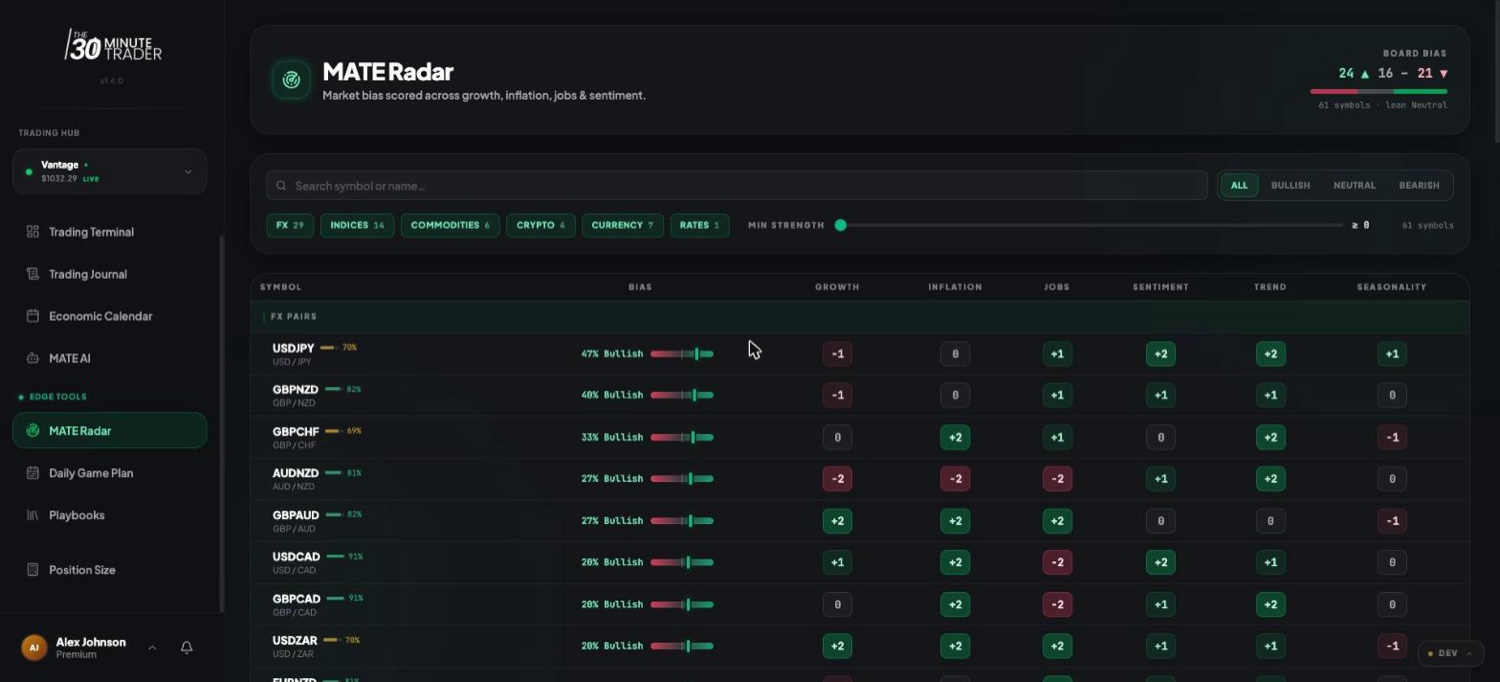
MATE Radar is a daily market-bias board. It scores a set of symbols — FX pairs, indices, commodities, and crypto — across a handful of factors and shows you, at a glance, where the broad bias is leaning bullish, neutral, or bearish. It is built to give you context before you plan a session, not to tell you what to buy or sell. Read it the way you would read the morning weather: it frames the conditions, you still make the call.
What MATE Radar is (and isn't)
MATE Radar scores the prevailing market bias for each symbol and lays it out as a grid. It is a snapshot of conditions for a given data window, regenerated as new data comes in.
Radar is context, not a signal. It does not generate buy or sell recommendations, entries, exits, or price targets. A symbol leaning bullish on Radar is not a cue to go long — it is a starting point for your own analysis. Use Radar to frame the question, then do the work to answer it with your own plan and risk rules.
How to read a symbol's overall bias
Each row shows one symbol with its name and an overall Bias. The bias is written as a strength percentage plus a direction — for example 47% Bullish, or simply Neutral when the lean is slight. The percentage reflects how strongly the factors agree, not a probability and not an expected return; a higher number means a stronger overall lean in that direction, not a stronger signal to act.
Direction follows a simple, fixed color scale that is consistent across the whole board:
Symbols are grouped by asset class (FX, Indices, Commodities, Crypto) and, within each group, the most bullish symbols are listed first so the board reads as a gradient rather than a wall of numbers.
Some rows also carry a small data-quality indicator — a short bar and a percentage. It reflects how complete and how fresh the underlying data is for that symbol. A lower number means the row is built on sparser or older data, so it should read as less authoritative than a fully-populated one.
The factor columns
Alongside the overall bias, each symbol is broken out into six factor columns. Each cell is a small score: positive (green) leans bullish for that factor, negative (red) leans bearish, and a quiet "—" means there is no data for that factor on that symbol (which is different from a genuine neutral 0).
The factor columns are where Radar earns its keep. The overall bias is a summary; the columns let you see why it leans the way it does and whether the factors agree or pull against each other. A symbol can read bullish overall while one factor leans the other way — that disagreement is exactly the kind of context worth noticing before you plan a trade.
The Board Bias summary
At the top of the board, Board Bias gives you the shape of the whole market at a glance. It shows the count of symbols leaning bullish (▲), neutral (–), and bearish (▼), along with a small bar that visualises the spread and the overall "lean" of the board. The counts always cover every scored symbol, even when you have filters applied to the table below — so the summary stays a true read of the whole board while you narrow the grid.
A board that is broadly bullish or broadly bearish tells you the macro winds are blowing one way; a mixed board tells you conditions are choppy. Either way, it is context for how you approach the day, not an instruction.
Searching and filtering
The board is built to be narrowed down to what you care about:
- Search — type a symbol or name to jump straight to it.
- Bias — filter to All, Bullish, Neutral, or Bearish to focus on one side of the board.
- Asset class — toggle FX, Indices, Commodities, and Crypto on or off (each shows a count). Hide the classes you don't trade.
- Minimum strength — a slider that hides weaker readings so only symbols with a stronger lean remain. Slide it up when you only want to see where the board has real conviction.
A running count shows how many symbols match, and a one-click Clear resets everything back to the full board.
Going deeper on a symbol
Select any row to open its detail view, where you can see the breakdown behind the score for that single symbol. This is the place to understand the read before you build a plan around it — and, where available, to ask MATE about the symbol so the context flows into your own analysis rather than standing in for it.
Who gets MATE Radar
MATE Radar is an Edge-tier tool — part of the workflow layer that sits around MATE AI for traders planning structured sessions. Access scales by program and tier (Starter / Basic / Edge / Coach), so what you see depends on your plan. If Radar is locked for you, the board shows a preview of what Edge unlocks.
To check what your program includes, see your programs; to understand how the tiers work alongside MATE AI, see the MATE AI page.
Where to go next
See what your program and tier include, and where MATE Radar fits.
How the Starter / Basic / Edge / Coach tiers work, and how MATE uses Radar context.
Turn the context Radar gives you into reusable, trade-linked setup rules.
The economic events behind the growth, inflation, and jobs factors.