Trading Terminal
The Trading Terminal is your performance command center for a single trading account. It pulls together the account's balance and equity, the metrics that describe how you trade (win rate, profit factor, expectancy, drawdown, and more), an equity curve, your open positions, and a trading calendar — all in one view. Everything on the page reflects the account you've selected in the account switcher, so switching accounts re-draws the whole Terminal for that account.
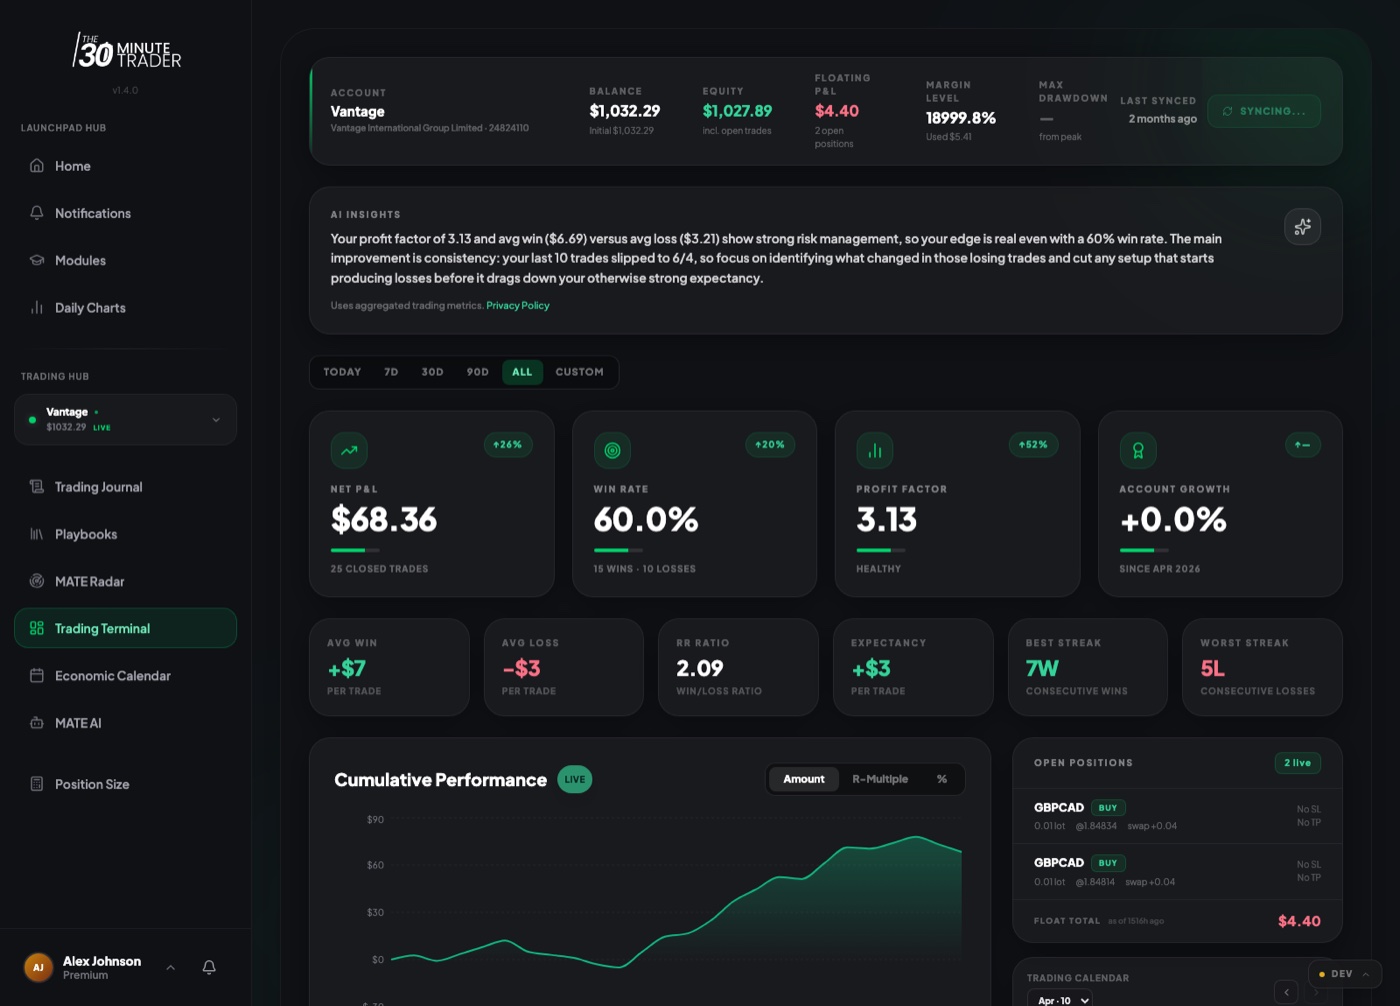
The account summary
A strip across the top of the Terminal shows the live state of the selected account at its last sync:
- Balance — your closed, settled account balance, with your initial deposit shown beneath it.
- Equity — balance including any open trades, so it moves with your floating positions.
- Floating P&L — the unrealized profit or loss on positions that are still open, with a count of how many are open.
- Margin Level — how much of your account is committed as margin, with the margin amount in use.
- Max Drawdown — the largest drop from a peak in your recent balance history, as a percentage.
- Last Synced — how long ago the account last pulled data, with a Sync Now button to refresh.
The key metrics
Below the summary, the Terminal breaks your trading down into metric cards. Each one is computed from your closed trades for the time range you've selected. In one line each:
Each metric card also shows a small change indicator comparing your most recent trades to the batch before them, so you can see whether a number is trending up or down.
The cumulative performance chart
The Cumulative Performance chart plots how your account has built up over the selected range. Use the toggle in its top-right corner to switch how performance is measured:
- Amount — your running profit or loss in account currency.
- R-Multiple — performance measured in units of risk, so a +2R trade counts the same regardless of position size.
- % — performance as a percentage.
The R-Multiple and % views are useful for comparing trades on a level footing, separate from how large each position was.
Open positions
The Open Positions panel lists the trades that were still open at your last sync — symbol, direction (buy or sell), volume, entry price, and any stop-loss or take-profit levels. A footer totals the floating P&L across those positions and notes how long ago the data was synced. If you had nothing open at the last sync, the panel says so.
The AI Insights panel
The AI Insights panel gives you a short, plain-language read of your stats — a quick summary of what your numbers are saying, written in everyday terms rather than tables. It's generated from the trades currently in view, so it follows the time range you've chosen. For a fuller, conversational breakdown of your performance, head to MATE AI.
The insight reflects whatever range is selected — narrow the range to get a read on a specific stretch of trading.
Choosing a time range
The time-range filter sits just under the account summary. Pick Today, 7D, 30D, 90D, or All, or choose Custom to set your own start and end dates. Every metric, the equity chart, the AI Insights read, and the trade history all recalculate for the range you pick. When you're on any range other than All, the Terminal also shows how many trades fall inside it. The trading calendar highlights your daily results so you can spot strong and weak days at a glance.
The Terminal always reflects the account chosen in the account switcher. To compare accounts, switch the selected account and the whole page redraws for it.